Octave plots for visualizing alpha diversity
See also
otutab_octave command
Interpreting octave plots
Log-normal abundance distribution
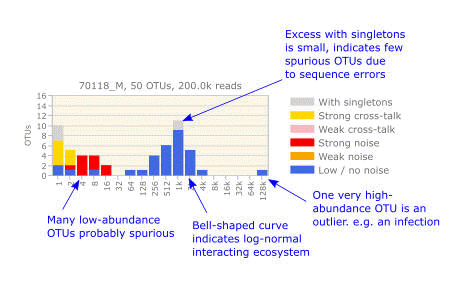
An octave plot (Edgar and Flyvbjerg 2018) is a histogram showing the OTU abundance distribution for a sample or a set of samples. This is a method for visualizing alpha diversity .
Histogram bars may be colored to indicate OTUs which may be spurious due to sequence errors or cross-talk .
Abundances are binned so that the height of a histogram bar is the number of OTUs in that bin. Each bin is defined by a range of abundances, and each bin is double the size of the previous bin. The first bin has singletons (OTUs with abundance = 1), the second bin has doublets and triplets (OTUs with abundances 2 and 3), the third bin has abundances 4 to 7 and so on. This ensures that on a logarithmic scale, bins are evenly spaced and have the same size. Other bin boundaries proposed in the literature, e.g. (Preston 1948), have uneven bins which can cause distortion of the distribution shape (Edgar and Flyvbjerg 2018).
You can think of the x axis of the plot as using a logarithmic scale with base 2. Note that there are two different numbers which double from one bin to the next: (a) the minimum abundance, and (b) the range of abundances (how many distinct abundances are in the bin).
The example below illustrates features of an abundance distribution which can be seen in an octave plot. It was generated from reads of sample 70118 from Yow et al 2017.

Octave plots are a modified version of Preston plots (Preston, 1948), which introduced the term "octaves" for bins which double in size, by analogy with a musical note which doubles in frequency in each successive octave (middle C is 262Hz, C' is 524Hz, C'' is 1048Hz and so on). The key modifications (pun intended) in our octave plots are the bin boundaries, which are critically important for maintaining the shape of a distribution under incomplete sampling, and coloring to indicate likely spurious OTUs.
Example octave plots
Yow 2017 study with singleton excess, cross-talk and noise prediction
Yow 2017 study with singleton excess only
References
M. Yow et al. (2017) Characterisation of microbial communities within aggressive prostate cancer tissues, Infectious Agents and Cancer 12 (4), https://doi.org/10.1186/s13027-016-0112-7 .
F.W. Preston (1948), The commonness and rarity of species, Ecology 29 (3): 254-283, https://doi.org/10.2307/1930989 .
Reference (please cite)
R.C. Edgar and H. Flyvbjerg (2018), Octave plots for visualizing diversity of microbial OTUs, https://doi.org/10.1101/389833
• Octave plots visualize alpha diversity as a histogram
• Plots show shape and completeness of distribution

