Log-normal abundance distribution
See also
Octave plot
Interpreting octave plots
otutab_octave command
Considering the distribution of abundances or frequencies of OTUs (or species) is a method for characterizing the alpha diversity of a sample or community. Usually, there are large numbers of low-abundance OTUs and few high-abundance OTUs. See Wikipedia article on relative species abundance . The shape of the distribution can be modeled mathematically. Proposed shapes include log-normal, Fisher's log-series (different from log-normal), and geometric series.
In practice, abundance distributions observed in traditional biodiversity studies are often approximately log-normal, meaning that if the abundances are binned and plotted on a log-scale histogram then an approximately normal (bell-shaped) curve is seen. This can be understood theoretically by noting that if the abundance of an OTU is determined by independent random variables, then as the number of parameters increases the distribution will tend towards a Gaussian (this follows from the central limit theorem ).
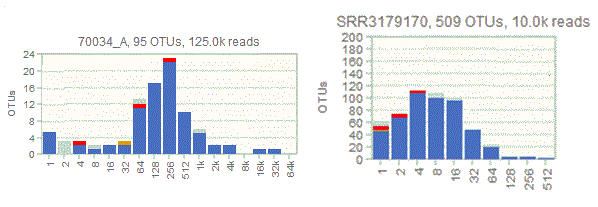
If all OTUs have been observed, and the distribution is approximately log-normal, then a complete bell curve will be seen, as in the octave plot on the left below. If sampling is incomplete, then the distribution is truncated so that (conceptually) some of the distribution is to the left of the y axis, representing OTUs which have not been observed (plot on right below). An important advantage of octave plots is that they preserves the shape when it is truncated due to incomplete sampling, which is not the case with the binning in Preston's paper (1948) or textbooks such as Measuring Biological Diversity (Magurran 2004).

If part or all of the distribution appears to be approximately log-normal, this suggests that these OTUs are participating in an interacting ecosystem.

