SCOP40 benchmark
SCOP40 is the de-facto standard benchmark for protein homology search. It is based on domains in the SCOP database clustered at 40% amino acid identity.
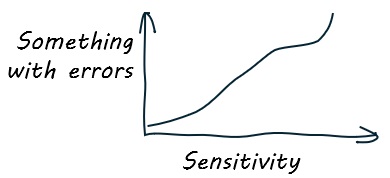
To measure homolog detection accuracy, an algorithm performs an all-vs-all search of SCOP40 domains, discarding trivial self-hits. At a given E-value or alignment score cutoff, the number of true positivs (TPs) and false postives (FPs) is measured. To show the range of trade-offs that can be achieved, the results are usually summarized in a plot which shows sensitivity on the x axis and a measure which includes errors on the y axis.

Sensitivity may be called "recall" or "true positive rate", these are the same thing. If the y axis is false positive rate (FPR), i.e. the fraction of hits which are FPs, then the graph is called a Receiver Operator Characteristic plot (ROC). Alternatively, the y axis may be can be precision, which is the fraction of hits above the threshold which are TPs, this is a precision-recall (P-R) plot.
While P-R curves have been used to report SCOP40 results in recent papers, these plots are problematic for a few reasons. They were designed for benchmarking binary classifiers, but it is a bit of a stretch to consider a protein search algorithm as a binary classifier. The number of TPs is a very small fraction of the database, and may be zero. Also, the ubiquitous use of E-values shows that biologists prefer to control errors by limiting the number of expected errors per query. For example, if with an E-value threshold of 10 there should be roughly 10 errors per query according to the algorithm's estimate. But if you mix TPs and FPs by using a measure such as precision or FPR, you can't assess sensitivity as a function of false-positive errors per query (FPEPQ). Also, ROC and P-R plots do not scale, so accuracy measured on SCOP40 does not predict accuracy in a much bigger database such as AFDB . These points are discussed in detail in the Reseek paper.

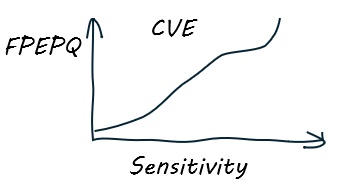
To address these issues, the developers of SCOP40 (Brenner et al 1998) proposed a new type of plot, Coverage versus Error (CVE). Here, the y axis is FPEPQ. If the search algorithm estimates a perfect E-value, then FPEPQ = E.

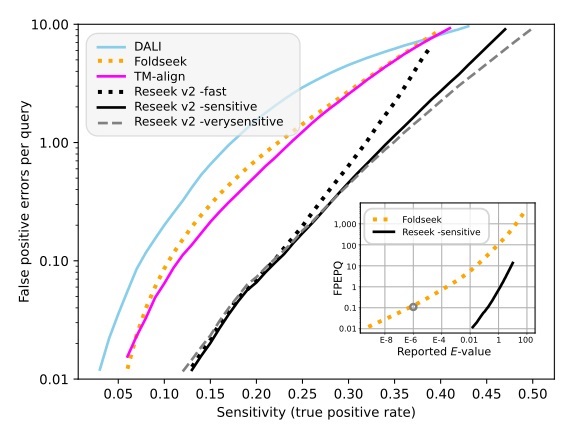
Sensitivity vs. errors for homolog detection on SCOP40.
TPs are hits to the same superfamily, FPs are hits to different superfamilies. Higher accuracy is reflected by fewer errors at a given sensitivity, which gives a curve lower and to the right. This shows that Reseek has substantially higher sensitivity than previous methods including DALI, TM-align and Foldseek. Inset is reported E-value vs. FPEPQ, which shows that Reseek E-values are in good agreement with measured error rates, while Foldseek E-values are underestimated. For example, at Foldseek E-value threshold 1E-6 (circled), the measured FPEPQ is ~0.1, i.e. five orders of magnitude higher than the estimate.
Reference
Brenner, S.E., Chothia, C. and Hubbard, T.J., 1998. Assessing sequence comparison methods with reliable structurally identified distant evolutionary relationships. Proceedings of the National Academy of Sciences, 95(11), pp.6073-6078. https://www.pnas.org/doi/pdf/10.1073/pnas.95.11.6073
SCOP40 is the de-facto standard benchmark for protein homology search. It is based on domains in the SCOP database clustered at 40% amino acid identity.
To measure homolog detection accuracy, an algorithm performs an all-vs-all search of SCOP40 domains, discarding trivial self-hits. At a given E-value or alignment score cutoff, the number of true positivs (TPs) and false postives (FPs) is measured. To show the range of trade-offs that can be achieved, the results are usually summarized in a plot which shows sensitivity on the x axis and a measure which includes errors on the y axis.

Sensitivity may be called "recall" or "true positive rate", these are the same thing. If the y axis is false positive rate (FPR), i.e. the fraction of hits which are FPs, then the graph is called a Receiver Operator Characteristic plot (ROC). Alternatively, the y axis may be can be precision, which is the fraction of hits above the threshold which are TPs, this is a precision-recall (P-R) plot.
While P-R curves have been used to report SCOP40 results in recent papers, these plots are problematic for a few reasons. They were designed for benchmarking binary classifiers, but it is a bit of a stretch to consider a protein search algorithm as a binary classifier. The number of TPs is a very small fraction of the database, and may be zero. Also, the ubiquitous use of E-values shows that biologists prefer to control errors by limiting the number of expected errors per query. For example, if with an E-value threshold of 10 there should be roughly 10 errors per query according to the algorithm's estimate. But if you mix TPs and FPs by using a measure such as precision or FPR, you can't assess sensitivity as a function of false-positive errors per query (FPEPQ). Also, ROC and P-R plots do not scale, so accuracy measured on SCOP40 does not predict accuracy in a much bigger database such as AFDB . These points are discussed in detail in the Reseek paper.

To address these issues, the developers of SCOP40 (Brenner et al 1998) proposed a new type of plot, Coverage versus Error (CVE). Here, the y axis is FPEPQ. If the search algorithm estimates a perfect E-value, then FPEPQ = E.

Sensitivity vs. errors for homolog detection on SCOP40.
TPs are hits to the same superfamily, FPs are hits to different superfamilies. Higher accuracy is reflected by fewer errors at a given sensitivity, which gives a curve lower and to the right. This shows that Reseek has substantially higher sensitivity than previous methods including DALI, TM-align and Foldseek. Inset is reported E-value vs. FPEPQ, which shows that Reseek E-values are in good agreement with measured error rates, while Foldseek E-values are underestimated. For example, at Foldseek E-value threshold 1E-6 (circled), the measured FPEPQ is ~0.1, i.e. five orders of magnitude higher than the estimate.
Reference
Brenner, S.E., Chothia, C. and Hubbard, T.J., 1998. Assessing sequence comparison methods with reliable structurally identified distant evolutionary relationships. Proceedings of the National Academy of Sciences, 95(11), pp.6073-6078. https://www.pnas.org/doi/pdf/10.1073/pnas.95.11.6073


