
OTU table
 See also
Making an OTU table (otutab command)
Interpreting an OTU table
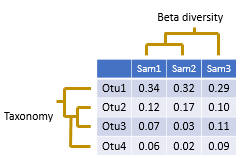
Diversity analysis
An OTU table is a matrix that gives the number of reads per sample per OTU. One entry in the table is usually a number of reads, also called a "count", or a frequency in the range 0.0 to 1.0.
It is often assumed that read counts in OTU tables are approximately equivalent to observations of species in traditional ecology. However, interpreting OTU reads counts is actually much more difficult because of biases and errors introduced by PCR and sequencing.
OTU tables are often stored as a tabbed text files in which OTUs are rows and samples are columns; e.g. the QIIME classic format . A notable exception is the mothur "shared" file format which does the opposite: rows are samples and columns are OTUs. The mothur format can be hard to review visually in a text editor or spreadsheet because there are usually many more OTUs than samples so you have to a lot of horizontal scrolling. That's why I prefer QIIME classic. The BIOM formats are much more complicated and have no practical advantages in my opinion. You can use the otutab2biom command to create a BIOM file that is compatible with other software packages that don't support QIIME classic.
Tables stored as tabbed text can be viewed and edited in a spreadsheet program such as Excel.
Common file formats for storing OTU tables include:
QIIME classic tabbed text
QIIME map file
Mothur "shared" file
BIOM v1 (JSON)
BIOM v2 (HDF5)