Setting an OTU abundance cutoff using an octave plot
See also
Octave plot
Interpreting an octave plot
otutab_octave command
otutab_trim command
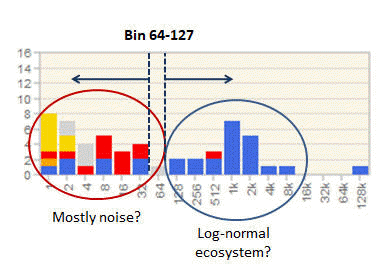
The example octave plot below is for a sample from the Yow et al. 2017 prostate study. This study generated an unusually high read depth of >200,000 reads per sample. For most samples, as in the example below, most OTUs in the first six bins appear to be noise due to cross-talk or sequence error. The bin with abundance 64 to 127 is consistently at the border between spurious and good OTUs, suggesting that an minimum abundance of around 100 is needed. The otutab_trim command can be used to apply the cutoff.


