otutab_select command
See also
OTU importance
K-fold cross-validation
The otutab_select command identifies OTUs for which abundance correlates with metadata state. For example, it might identify OTUs which are more abundant in a diseased sample compared with a healthy sample.
In machine learning , identifying informative variables is called feature selection ; hence the use of "select" in the command name.
A metadata file must be specified by the -meta option. There must be exactly two categories; here I will call them Yes and No but you can use any names you like. If you have more than two, you can choose one category to be Yes and edit the metadata file to rename all the other categories to No.
Output is written to a tabbed text file specified by the -tabbedout option.
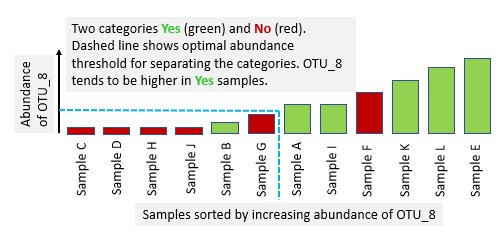
An OTU is informative if the samples can be divided approximately or exactly into Yes and No groups by setting an abundance threshold. Ideally, all Yes samples would be in one group and all No samples would be in the other.

The quality of a partition can be assessed by a metric which considers how many Nos are in the Yes group, and vice versa. The otutab_select command uses the following two metrics.
Gini impurity . This is a measure of how often a randomly chosen element would be incorrectly labeled if it was assigned the label of the majority in its group. It has a minimum value of zero when the labels are perfectly partitioned into two separate groups and a maximum of one when half the samples with each label is found in each group. The abundance threshold is reported which minimizes Gini impurity, together with the Gini impurity value at that threshold.
AUC = Area under the ROC curve . Conceptually, the ROC curve is generated by considering the abundance of the OTU to be a classifier confidence value, where the classifier is attempting to predict whether the sample is Yes or No. AUC has a maximum value of one when the labels can be perfectly partitioned and a minimum of 0.5 when the OTU is not informative. The abundance threshold is reported which maximizes AUC, together with the AUC value at that threshold.
The output file is sorted in order of increasing minimum Gini impurity so that the most informative OTUs appear first. This should be similar to sorting in order of decreasing maximum AUC. Often, Gini impurity, AUC and random forests identify similar sets of informative OTUs. A plus (+) or minus (-) sign indicates whether high or low abundance implies the positive (first, Yes) category.
Example
usearch -otutab_select otutab.txt -meta meta.txt -tabbedout select.txt

