Low-divergence chimeras are common
See also
Chimeras
Fake chimeras
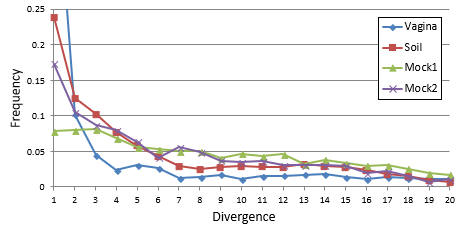
The figure below (from the UCHIME2 paper) shows measured distributions for four samples with a wide range of diversities: soil (very high diversity), human vagina (low), and two mock communities (very low), which nevertheless exhibit similar distributions with an inverse correlation between divergence and frequency. The horizontal axis is divergence, i.e. the number of differences between a chimera and the closest known non-chimeric sequence (which is almost certainly one of its parents in this analysis). The vertical axis is frequency calculated as a fraction of all chimeras found in a sample.In all samples, a majority of chimeras have divergence < 10.

Reference (please cite)
R.C. Edgar (2016), UCHIME2: improved chimera prediction for amplicon sequencing, https://doi.org/10.1101/074252
• UCHIME2 algorithm, improved chimera detection
• "Fake" chimeras are common, valid biological sequences matching two-parent model
• Perfect chimera filtering impossible even with complete and correct reference
• Realistic chimera benchmark

