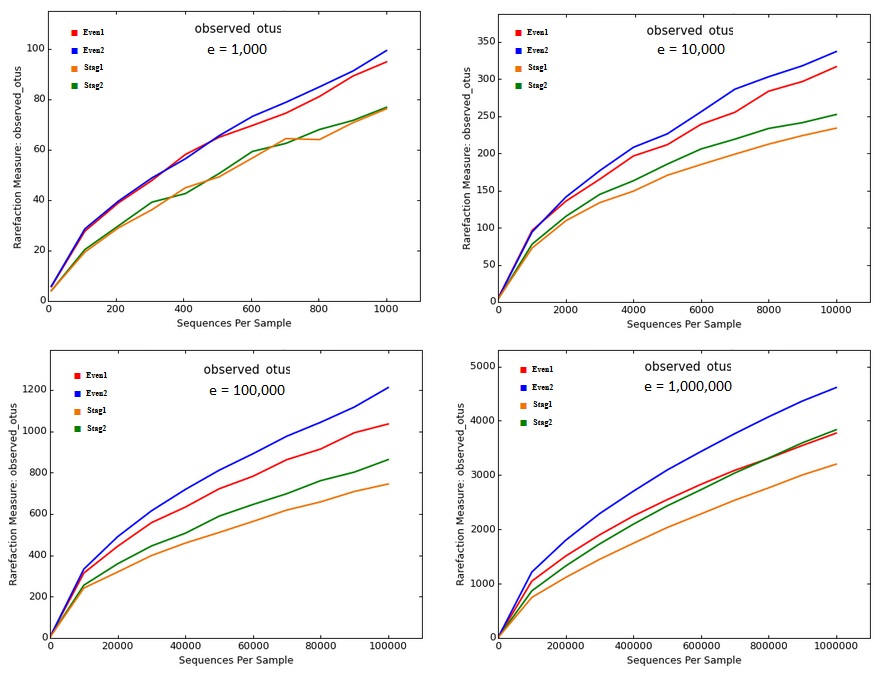
QIIME grossly over-estimates mock community diversity
See also
Defining and interpreting OTUs
Alpha diversity
Problems with closed- and open-reference clustering
Spurious OTU in mock vs. real data
Below are rarefaction curves generated by QIIME from Illumina V4 reads of a mock community with 22 strains; data from ( Bokulich et al. 2013 ). There are four samples, two Even and two Staggered. These figures were generated by the core_diversity_analaysis.py script generated using the procedure recommended by the QIIME Illumina tutorial ( http://qiime.org/tutorials/otu_picking.html , accessed 25 Apr 2017), except for sampling depth (- e option) which is left for the user to decide. I tried a range of read depths from one thousand to one million.
The curves show that richness is inflated from a factor of ~5x (~100 OTUs at a depth of one thousand reads per sample, which is very shallow by today's standards, to ~200x (~5,000 OTUs at a depth of one million). No convergence is seen in the rarefaction curves, reflecting that almost all OTUs are due to errors which accumulate at a roughly constant rate as the number of reads increases. Thus, the reported "alpha diversity" mostly measures the diversity of uncorrected experimental artifacts rather than of biologically meaningful groups.

Reference (please cite)
R.C. Edgar (2017), Accuracy of microbial community diversity estimated by closed- and open-reference OTUs, PeerJ 5:e3889
• QIIME closed- and open-reference clustering generates huge numbers of spurious OTUs
• Closed-reference OTU assignment splits strains and species even when no sequence errors
• Closed-reference fails to assign different hyper-variable regions to the same OTU
• Closed-reference discards many well-known species that are present in Greengenes

