Alpha diversity
See also
Alpha diversity metrics
Octave plots
Interpreting diversity metrics
Recommended alpha and beta metrics
Comparing alpha diversity between groups
Statistical significance of diversity differences
Rarefaction
alpha_div command
alpha_div_rare command
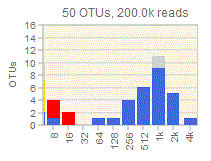
 Alpha diversity is the diversity in a single ecosystem or sample. The simplest measure is richness, the number of species (or OTUs) observed in the sample. Other metrics consider the abundances (frequencies) of the OTUs, for example to give lower weight to lower-abundance OTUs. See alpha diversity metrics . The abundance distribution can be visualized using an octave plot .
Interpretation
It is important to keep in mind that NGS amplicon sequencing cannot reliably measure frequencies or presence / absence of OTUs , so the biological meaning of alpha diversity metrics developed for traditional ecology is unclear / misleading / difficult to interpret.
Estimators
Some rare species may not have been observed. An alpha diversity estimator attempts to extrapolate from the available observations (reads) to the total number of species in the community. The best-known estimator for NGS OTUs is Chao1. In my opinion, estimators cannot be usefully applied to NGS OTUs because rare species are underrepresented if an abundance threshold is used (e.g., discarding singletons), and regardless the number of spurious OTUs increases at low abundances. The low-abundance tail of the distribution is therefore highly uncertain, and attempting to extrapolate makes no sense.
Rarefaction
The goal of rarefaction is to get an indication of whether enough observations have been made to get a good measurement of an alpha diversity metric. This is done by making a rarefaction curve which shows the change in a metric as the number of observations increases. If the curve converges to a horizontal asymptote, this indicates that further observations (i.e., more reads) will have little or no effect on the metric. As with estimators, the asymptote of a rarefaction curve depends on the low-abundance tail of the distribution, and is therefore of dubious value when applied to NGS reads. The number of OTUs is almost certain to increase with more reads due to errors, even if all species in a sample have been accounted for, and it is therefore almost certain that the rarefaction curve will converge to a positive slope.
Units of measurement
Confusingly, alpha diversity metrics often use different units. Sometimes the meaning is not obvious (entropy!?), and metrics with different units cannot be compared with each other. For example, the popular Shannon index is a measure of entropy where the unit is bits of information if the logarithms are base 2, but people sometimes use natural logarithms (base e) or base 10. None of these variants of the Shannon index have an obvious connection to the number of OTUs, and people often do not say which variant they used, so the numerical values are difficult to interpret.
Effective number of OTUs
Metrics using unfamiliar units can be interpreted and comparied by converting to an effective number of species .

