See also
Defining and
interpreting OTUs
Interpreting counts
in OTU tables
Abundance bias
UNBIAS paper
unbias command

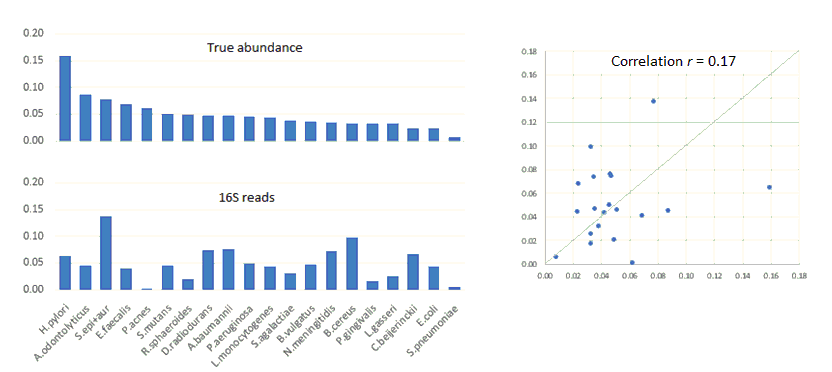
Species frequencies determined by shotgun sequencing (top-left) and 16S
read frequencies (bottom-left). The Pearson correlation between the freqency
distributions is 0.17 (right). Figure from UNBIAS paper.