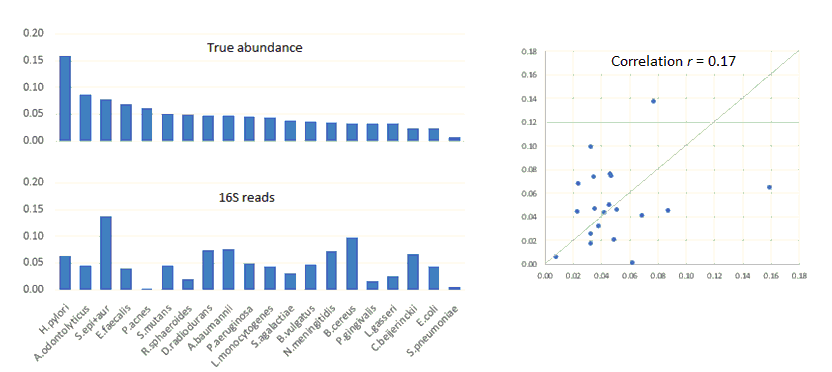
Low correlation between read abundance and species abundance
See also
Defining and interpreting OTUs
Interpreting counts in OTU tables
Abundance bias
UNBIAS paper
unbias command

Species frequencies determined by shotgun sequencing (top-left) and 16S read frequencies (bottom-left). The Pearson correlation between the freqency distributions is 0.17 (right). Figure from UNBIAS paper .

