See also
FASTQ files
FASTQ commands
Expected errors
The fastq_eestats command reports statistics on quality scores and expected errors.
See fastq_eestats2 for a related command which generates a more readable summary.
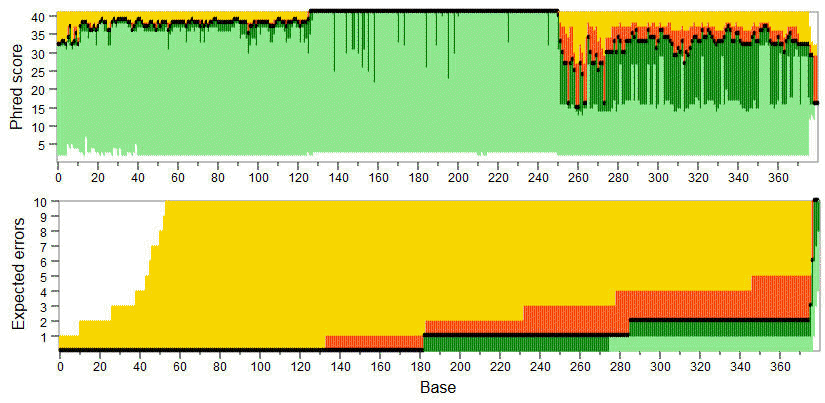
The report is written to a tabbed text file specifed by the -output option. The distribution Phred (quality) scores and expected errors is reported in terms of the mean and quartiles.
Fields in the tabbed text file are:
Pos: zero-based position in the read.
Reads: number of reads that include this position.
PctRecs: fraction of reads that include this position, as a percentage.
Min_Q: Minimum Q score.
Low_Q: Lower quartile Q score.
Med_Q: Median Q score.
Mean_Q: Mean Q score.
Hi_Q: Upper quartile Q score.
Max_Q: Maximum Q score.
Min_EE: Minimum EEs.
Low_EE: Lower quartile EEs.
Med_EE: Median EEs.
Mean_EE: Mean EEs.
Hi_EE: Upper quartile EEs.
Max_EE: Maximum EEs.
Here, EEs means the total expected errors for positions zero through the current position. The tabbed text file can be loaded into a spreadsheet or other program for generating plots of read quality as in the example below where light green=below lower quartile, dark green=lower quartile, black line=median, red=upper quartile, yellow=above upper quartile.
Example
usearch -fastq_eestats reads.fastq -output eestats.txt

