See also
OTU benchmark
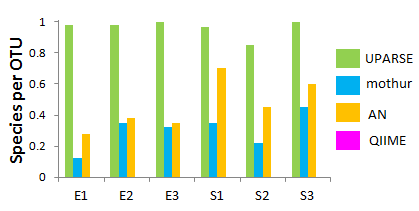
Species per OTU on HMP
mock communities
Since most methods produce many OTUs per species, I used the inverse ratio,
i.e. number of species divided by number of OTUs, to produce a measure that
usually falls in the range zero to one. I estimated the number of species as the
sum of the number of mock species found, plus the number of OTUs classified as
Contaminant.
For the 454 datasets, the QIIME species per OTU values are too small to be visible, ranging from 0.005 (Stag2P) to 0.014 (Stag1P).
For the Illumina datasets (not shown in figure), UPARSE OTUs have 0.95 species per OTU, while QIIME has 0.1 species per OTU.
The much closer agreement between the number of OTUs and the number of mock species plus detected contaminants achieved by UPARSE compared to the other assessed pipelines suggests that UPARSE may generate OTUs that are closer to 1:1 correspondence with species on samples collected in vivo.
Reference
Edgar, R.C. (2013) UPARSE: Highly accurate OTU sequences from microbial amplicon reads,
Nature Methods [Pubmed:23955772,
dx.doi.org/10.1038/nmeth.2604].