UCHIME2 chimera benchmark
See also
Chimeras
Fake chimeras
Low-divergence chimeras are common
Earlier work, in particular the first UCHIME paper and the ChimeraSlayer paper, characterized chimeras by parent divergence (100% minus identity of the parent sequences to each other) because detection is harder when parents are similar. However, a chimera can be arbitrarily close to one parent, e.g. if the other's segment is short.
A better indication of detectability is the number of differences compared to the closest known non-chimeric sequence (reference divergence, D). Measured frequencies of chimeras with 1 <= D <= 20 are reported in Fig. 1 below, showing that frequency correlates inversely with D and a majority have D < 10. I also considered the identity of a segment with its closest reference sequence (segment identity, S). In practice, one of both parents is usually missing from the database, i.e. S < 100%, which makes it harder to detect the chimera.
Previously published tests of reference-based chimera detection methods use simulations which assume, unrealistically, that parent sequences are known, i.e. S = 100%. To investigate the dependence of prediction accuracy on both D and S, I designed a new benchmark, CHSIMA, with simulated 16S and ITS chimeras with D = 1 to 10 and S = 90% to 100%.
False positives (FPs) were measured by dividing a chimera-free database into pairs (splits) with identities from 90% to 100%. I calculated sensitivity as the fraction of simulated chimeras that were correctly predicted and, unlike previously published tests, included false negatives (FNs) as well FPs in the error rate because both may be comparably harmful, especially when D > 3% where FNs cause spurious OTUs and FPs discard valid biological sequences. For assessments of DECIPHER and CATCh, which show DECIPHER to have very low sensitivity. The balanced and sensitive modes of UCHIME2 have higher sensitivity than previous methods, with balanced having the lower overall error rate, and the high-confidence mode reports fewer false-positive (see Table 1 below).
Fig. 1. Chimera frequency as a function of divergence.
Measured distributions for four communities with a wide range of diversities: soil (very high diversity), human vagina (low), and two mock communities (very low), which nevertheless exhibit similar distributions with an inverse correlation between divergence and frequency. See Supp Note 2 of UCHIME2 paper for methods. The horizontal axis is divergence, i.e. the number of differences between a chimera and the closest known non-chimeric sequence (which is almost certainly one of its parents). The vertical axis is frequency calculated as a fraction of all chimeras found in a sample. In all samples, a majority of chimeras have divergence < 10.
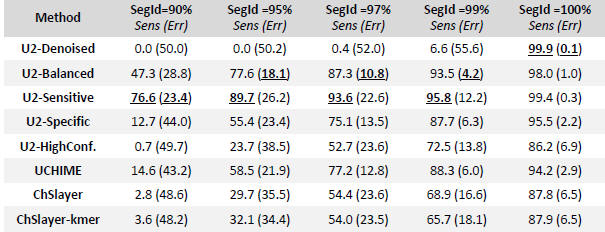
Table 1. CHSIMA test results on the 16S V4 region.
Table entries are sensitivity (%) and total error rate (%) including both FPs and FNs. The highest sensitivity and lowest error rate for each SegId are underlined.